R-studio/R project for the Data Activities of the module
Repository
Written in
Mathematics and statistics are closely related to data science. Even though data science is generally considered a relatively new discipline, traditional mathematics and statistics have a direct application and provide robust foundations for applying data science concepts (Hardin & Horton, 2017). An extension of data science is also the related statistics and data science softwares, such as the R language. All the above have been studied during the 12-unit module of Numerical Analysis.
Due to my background in Computer Science with a specialization in knowledge extraction and information systems, the concepts of numerical analysis, statistics, and the use of R language were not new to me, albeit I lacked practical knowledge, which is one of the fundamental pillars of the learning process (Reynolds et al., 2004). Simple R functions, such as import, export and basic mathematical computations, were easy to be performed. Moving to more complex concepts such as creating plots, performing hypothesis tests, and finding correlations and regressions challenged me intellectually and was one of the most important parts of this module. Weekly data activities have been very beneficial in practically applying theoretical knowledge.
Due to its nature, this module did not allow collaboration between students; therefore, one's study and exercise were needed to benefit from the outcomes of the module. Apart from the theoretical study time that I had to undertake in order to renew my existing knowledge and understand more extensive statistics concepts in data science, weekly data activities were one of the highlights of this module. Exploring the data in order to understand the format, exploratory data analysis, descriptive and inferential statistics, as well as visually presenting the outcome are exercises that have been performed as per the data activities' needs. A GitHub repository has been created for the needs of the eportfolio, aiming to record and further share the knowledge I gained through this module. The repository, along with the two final deliverables of this module, will be included in the dedicated eportfolio page, which is currently under construction, aiming to engage my peers in active participation, which is one of the aims of an eportfolio (Roberts et al., 2016).
As described above, several parts of practically applying knowledge challenged me intellectually. Having said that, the process of actively engaging with the content was far from easy. Due to my background, this module was confronted with fear, as mathematics (e.g. computational mathematics) is something I dislike and have had problems with since my pre-graduate education. The fear was succeeded by overconfidence as "Statistics in Computer Science" was one of the last modules of my bachelor's, which I passed with flying colours. This overconfidence did not allow me to engage appropriately with the content from the beginning. Even though emotions, while studying, are often neglected, I soon realized that either feeling would not help me learn and retain that knowledge (King et al., 2019). The decision to re-starting the whole module while the class was already going through Unit 5 was undoubtedly hard but beneficial. I had to force myself to go through all the relevant content of each unit, regardless of how confident I felt.
Already from unit 2, I realized the importance of what I was doing, as apart from learning new things, the realization that you never know enough kicked in and helped me proceed to the rest of the units with better morale and soon catch up with the rest of the class. In addition, studying for the mid-term test brought back memories from my pre-graduate studies and the fact that this test concentrated on concepts that I enjoyed helped me to proceed further. Besides the work I had to do with myself to overcome the feelings that were negatively affecting my learning process, brief discussions with my peers made me realize that this feeling of "boredom" may come from exhaustion due to the long working hours (Martil et al., 2006). This, in connection with the time I had available to study, which was always after 10 p.m., severely impacted my mood. Changing the environment and studying time immensely helped the whole process, and I certainly feel better about myself after achieving much more than I thought I could during this module.
When my emotions and responsibilities were set straight, I created an action plan for my studies, similar to the one I followed during my bachelor's degree. The goal per unit was to go through the description, read the mandatory readings and, if needed, some of the optional readings of the week, work on any non-graded assignments (for example, data activities) and finish the module with some notes, such as essential concepts or code that I found hard to write, and that I wanted to keep for further reference. The reading, thinking, acting and experiencing cycle I followed is similar to the "experiential learning cycle" (McCarthy, 2010). I found this method the most appropriate, as the module had to be as theoretical and practical, and practice could help me achieve the learning outcomes.
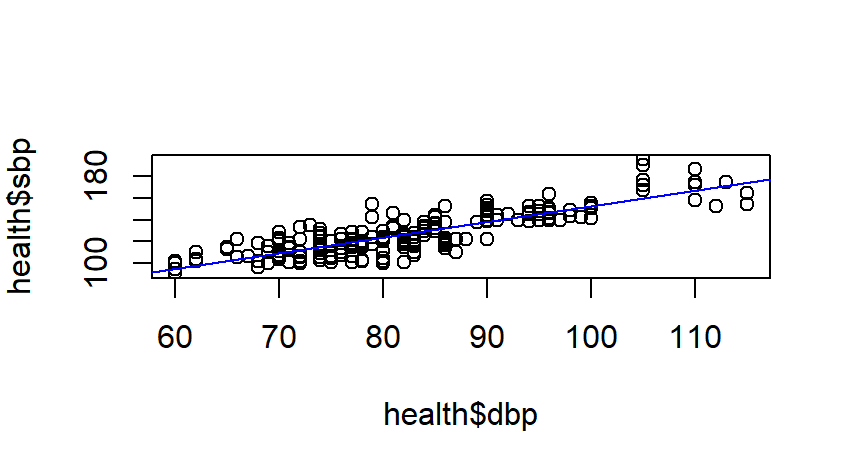
Following the above, due to my current work, I started to try and put into production what I have learned in every unit of this module. My primary focus was on the null hypothesis, regression analysis, presenting five-figure summaries, and correlation analysis. Moreover, the more profound knowledge of R language has helped me on creating custom visuals in PowerBI to present my findings on "what has happened" (data intelligence) and "what is going to happen" (data science). The created dashboard became an asset for the office I am working in and is used daily in at least seven countries.
All this process of treating the things that kept me back and later applying a systematic learning plan and gaining hand's on experience provided me with unique knowledge in both data science subjects and how to cope with psychological things that prevent personal, professional and academic development.
The current module, apart from the theoretical part also included specific data activities which have been grouped under a Github repo.
Written in