Exercise 8.1B
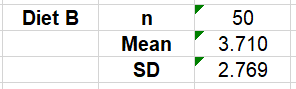
We observe the same count of observations as the Diet A participants. Moreover, the mean of the sample of Diet B
presents a smaller value than the mean of the sample of Diet A, therefore indicating a smaller weight loss. Finally,
the standard deviation of the sample of Diet B is slightly larger than the calculated standard deviation of the
sample of Diet A. Isolating the finding only in the sample of Diet B, and in comparison with the mean of the sample
of Diet B we have an indication smaller positive weight loss than the sample of Diet A, applying mean +/- stdev.
Exercise 8.1B
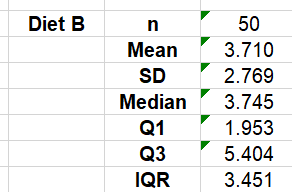
Continuing from the observations of the exercise 8.1B, the median of the sample of the Diet B signifies that the average data loss is close to the media data loss (two measures regularly confused with each other). Moreover, the IQR singifies a positive data loss or at least a high number of observations presented a positive (even if marginal) weight loss.
Exercise 8.3D
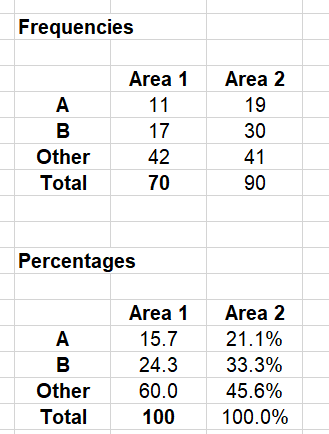
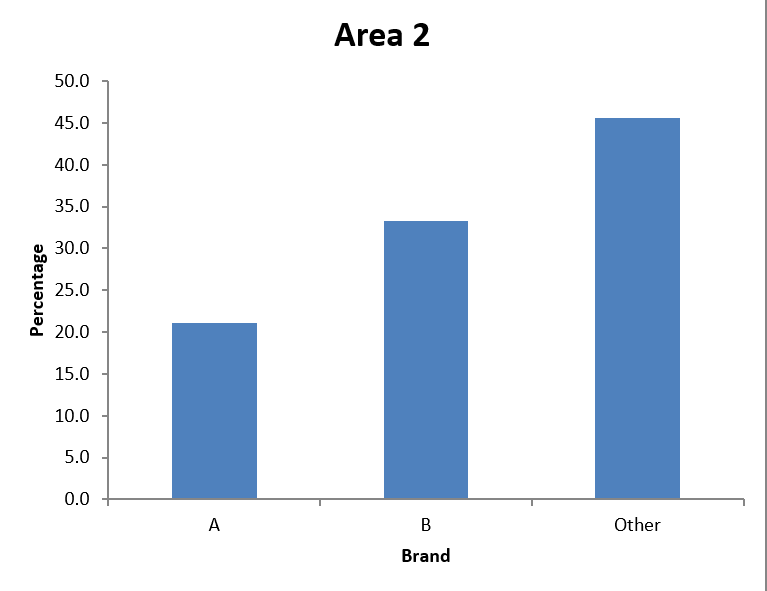
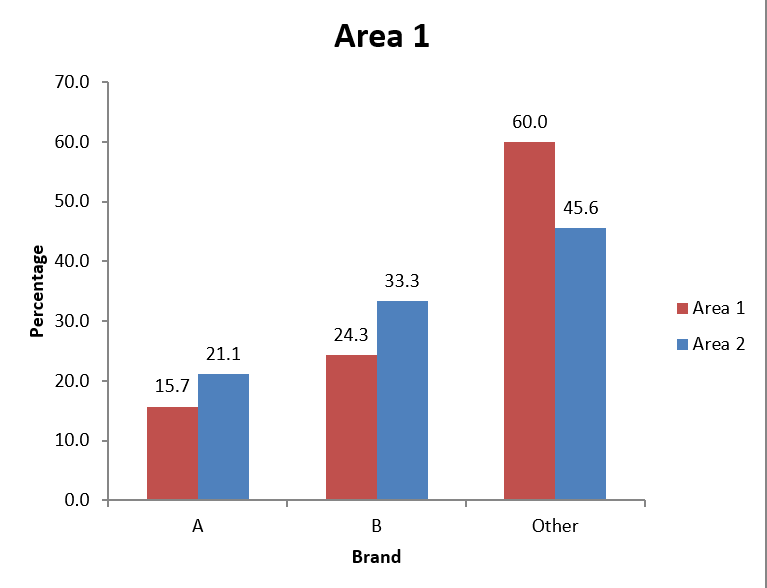
Most respondents of Area 2 (45.6%) prefer neither brand A nor brand B but another brand, second most (33.3%) prefer brand B, while the remaining 21.1% prefer brand A.
Exercise 8.4G
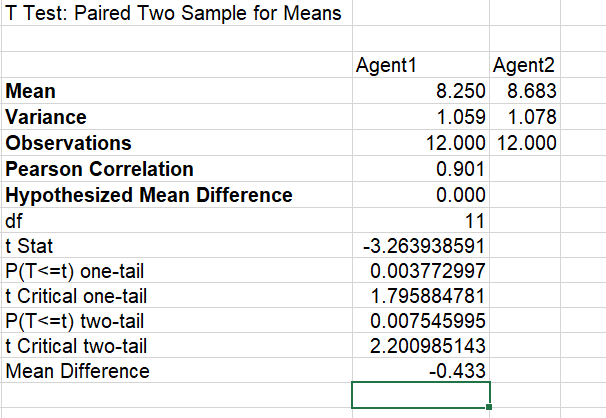
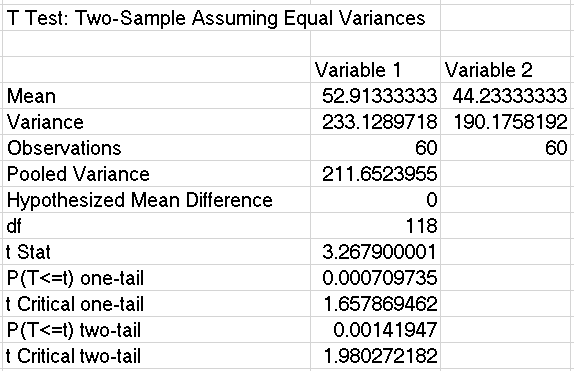
Considering the findings of the two tailed test we have a difference in the means of -0.433 for 11 degrees of freedom (n-1) with a t-test of -3.26 and a p-value P(T<=t)=0.007 for a=0.05. For the two tailed test the p-value is singificantly smaller from 0.05 and the mean difference is marginal. Having in mind that the metrics measure failure (impurities) and not success data suggest that Agent 1 should be preferred over agent two. With similar thinking for one tailed test we have a p-value P(T<=t)=0.004 for a=0.01 without changing the results but by achieving a higher confidence level.
Exercise 8.6C
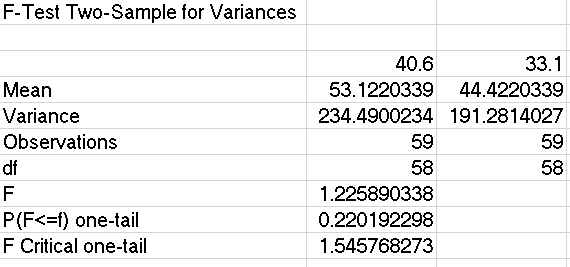
To start with, we immediately observe that the p-value for the F-test is bigger than the confidence level (p-value=0.22>a=0.01), therefore the f-ratio is insignificant. Moreover, we do a t-test through which we observe a positive mean difference and a p-value p(T<=t)=0.000 < a=0.01 for a one-tailed test, therefore data suggest that the sample mean income is greater for the male sample.
Exercise 9.1D
Exercise 9.2E
Exercise 9.3B

Exercises as provided by the university of Essex Online