As a general idea, transportation can be defined as the movement of elements, being animate or inanimate, from point A to point B. Due to the fact that transportation is closely interlinked with economies, the additional elements of speed, effectiveness, capacity, and efficiency can be added to the high-level definition of transportation. Undoubtedly, transportation uses mobile means (such as cars, trucks, aeroplanes, and ships) to achieve its objectives. Nowadays, complex systems, such as long railroads or roads, have been developed to be used by the said mobile means to move elements across the globe. Based on the above, transportation can be best defined as the process of moving elements, animate or inanimate, between points, with the utilization of mobile mechanical units, such as cars, trucks or ships, which provide the needed motive power depending on the elements that need to be moved, while achieving efficiency in terms of speed, force and costs (Cooley, 1894; Hall, 1999).
The Wales transportation system does not differ from what is described above. Initially, the Welsh transportation system was created due to the need to move agricultural products and was significantly shaped by Wale's geological characteristics and Wale's industrial history, starting from the early 19th century, affected by the industrial revolution (Welsh Assembly Government, 2008). By cross-referencing the maps of population density, rail network and road network, one can quickly notice the relationship between the density and the existing infrastructure. By being the most populated regions of Wales, North and South Wales have an extensive network of roads and railroads. In contrast, Mid and West Wales have a significantly sparser transportation system, while central Wales has a nearly non-existent railroad network. East Wales, even though it has less than 50 residents per square kilometre (less than any other region of Wales), has a denser road network, mainly due to its connection with the rest of England (Welsh Government, 2021; plumplot, 2020).
While the inter-region transport network appears to be extensive, as can be noticed by respective transport network maps, the main existing inter-region routes are East to West, with the routes between the rest of the regions being insufficient. Though, according to the Welsh Government's plan (2021), infrastructure improvement projects are ongoing, with public transportation funds being a significant portion of the overall budget. The public transportation network of Wales mainly compromises buses and trains (Welsh Government, 2022).
The National Survey of Wales on Transport for 2013 - 2014 presents the public's satisfaction with the transport system of Wales, which lies above the midpoint, with an average satisfaction of 6 out of 10, while having a minimum of 5.6 for two adult households without children and a maximum of 6.2 for single pensioners. Additionally, the people most in need of public transport, who do not own a car, appear to be more satisfied by the transport system, with 6.4 average satisfaction as opposed to car owners with a 5.8 average satisfaction. Moreover, as discussed above, in some less densely populated areas, transport networks appear to lack essential infrastructure, which is also shown in the national survey as there is a difference of 0.5 points in the public's satisfaction between rural and urban areas. Regions with fewer transport networks, such as the Mid and West of Wales, have the lowest satisfaction of 5.4, while North Wales' residents report a satisfaction of 6.2 on average, which is in line with the observations on the presence of transport networks in Wales.
Wales has an averagely aged population of 41.5 years (plumplot, 2020), and interestingly, the population in the specific age cohort presents the median satisfaction with the public transport network. The same does not apply to the unemployed, as, even though Wales has a lower unemployment rate than the rest of the UK (BBC, 2022), the population under this specific category presents higher satisfaction rates than the employed people. This may be due to numerous factors, which cannot be verified without access to the survey's raw data and metadata. On the access to the NHS, Wales currently has seven per cent of all UK hospitals within its administrative boundaries (Interweave Healthcare, 2021). Despite that, 18 per cent find it difficult to access hospitals with public transport, a figure that includes 22 per cent of the unemployed population and 22 per cent of the persons over 65 years old, which are considered older persons at risk, according to the United Nations (2021). On a final note on the survey, with Wales having 110 per cent of the national crime rate, with 36.9 per cent of all crimes being violent (plymplot, 2022), one-fourth of the citizens feel unsafe after dark, with nearly one-third of women feeling afraid after sunset.
The data analysis should be focused on what matters to the stakeholders. Generally speaking, one should move from the generic findings (e.g. overall satisfaction) to the most specific ones. Matters of priority, such as the safety and security of the citizens using the public transportation system, matters of social policy, such as how transportation benefits the sick, elderly and unemployed, should also be specified in a data analysis report. It is of utmost importance the creation of charts to present the findings of the reports.
The report's findings would be better presented using data visualization methods, such as graphs and infographics. The absence of metadata and raw data heavily reduces the observation of the complex underlying relationships that may exist in the survey population, and which may also show signs of biases in the sampling methodology. Starting with table 1, due to the number of different categories, the visual representation would be better served with the user of a treemap, while for table 2, a simple doughnut or pie chart would suffice, which is also valid for tables 4, 11, 13, 14 and 39. A pyramid chart would be beneficial for table 10, while tables with multiple categories across both axes, such as tables 26 and 29 through 32 and 34, 35, 37, 38, 40, and 41, would be best visualized using a sunburst chart or a cluster column/bar chart. Maps could also be used for tables referring to regions or municipalities.
As mentioned above, the absence of raw data and metadata significantly limits the data visualization options. If raw data were available, age and gender breakdown charts (such as pyramid charts), scatter plots, and network maps could also be used. Another issue with a data analysis report based on the available data is the lack of cross-referencing between different categories, which creates gaps in the analysis and prohibits the further use of data for a gap analysis on the use of public transportation significantly.
To summarize, the Welsh public transportation system serves well the citizens of Wales. Though, gaps do exist in the current structures, affecting especially people that need them the most. Those gaps need to be presented in an intuitive format to the relative stakeholders such as the Welsh Government, the transportation authorities and the regional administrative structures (municipalities and others), in order to create drive for change.
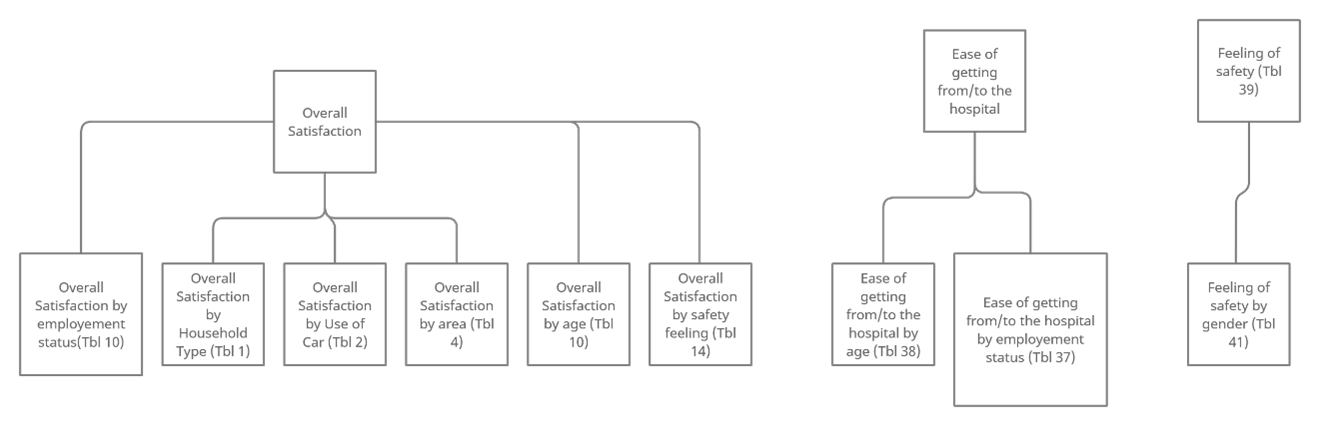
Figure 1: UML of selected tables